Discover the Secrets of Technical Analysis: The Ultimate Chart Patterns Cheat Sheet
![]() Sarah Rodriguez • 26 Apr 2023
Sarah Rodriguez • 26 Apr 2023

Welcome, fellow market enthusiasts and aspiring Wall Street wizards! Have you ever found yourself staring at a chart, feeling like you're trying to read the Matrix? Fear not, for today we're going to shed some light on the mystical world of technical analysis by unveiling the Ultimate Chart Patterns Cheat Sheet. This handy guide is about to become your new best friend, the Sherlock to your Watson, the Batman to your Robin, in the realm of stock trading.
We know that mastering the art of chart patterns can feel like learning a new language or cracking an ancient code. Luckily for you, we've done the heavy lifting and condensed the essentials into one cheat sheet so that you can spend less time deciphering charts and more time making smart, money-making moves.
So buckle up, dear reader, as we embark on this thrilling journey into the world of chart patterns, where X's and O's aren't just for hugs and kisses, and your financial future may hang in the balance of a trendline. Get ready to become a chart whisperer with our Ultimate Chart Patterns Cheat Sheet!
Introduction
Ahoy, financial adventurers and stock market swashbucklers! Have you ever gazed upon a stock chart, feeling lost in the sea of zigzagging lines, unsure of whether you've stumbled upon a treasure map or a cursed pirate's scroll? Fear not, my friends, for today, we're about to embark on a thrilling voyage to unravel the enigmatic world of technical analysis and unearth the Ultimate Chart Patterns Cheat Sheet.
We know that navigating the choppy waters of chart patterns can feel like a daunting odyssey, one that requires the courage and cunning of the most intrepid of explorers. But worry not, for we've braved the storm, wrestled the Kraken, and condensed the secrets of the seven seas into one trusty cheat sheet. With this treasure trove of knowledge at your fingertips, you'll be ready to set sail toward fortune and glory, conquering the world of stock trading like the legendary captain you were born to be.
So grab your compass, hoist the Jolly Roger, and join us as we delve into the depths of chart patterns, where treasure lurks beneath each twist and turn, and your destiny as a master of the stock market awaits!
Charting Your Course to Fortune: The Importance of Understanding Chart Patterns
In the stock market's vast and unpredictable ocean, chart patterns serve as a guiding star, helping traders and investors make more informed decisions. By recognizing and interpreting these patterns, you can gain valuable insights into the market's behavior, enabling you to anticipate potential price movements and seize profitable opportunities.
Chart patterns are the very language of the market, with each line, curve, and shape telling a unique story about supply, demand, and the psychology of market participants. By mastering this language, you'll be better equipped to navigate the treacherous waters of trading, avoiding the whirlpools of losses while riding the waves of success.
In short, understanding chart patterns is crucial for anyone looking to conquer the stock market seas and claim their share of the bountiful treasure that awaits. With our Ultimate Chart Patterns Cheat Sheet, you'll have a trusty compass to guide you on your journey to financial freedom and glory.
X Marks the Spot: Introducing the Ultimate Chart Patterns Cheat Sheet
Fear not, brave navigators of the stock market, for we have crafted the Ultimate Chart Patterns Cheat Sheet, a treasure trove of knowledge that will light your way through the stormy seas of trading. This comprehensive guide contains the most vital chart patterns you'll encounter on your journey, providing clear and concise explanations to help you decipher the market's secrets.
From reversal patterns that signal a change in the market's direction, to continuation patterns that indicate a trend's persistence, our cheat sheet covers it all. And for those more complex situations, we've even included bilateral patterns to help you prepare for the market's unpredictable twists and turns.
With the Ultimate Chart Patterns Cheat Sheet by your side, you'll have a powerful tool to steer your trading vessel toward fortune and success. So, hoist your sails, plot your course, and embark on a thrilling adventure, armed with the knowledge and confidence to conquer the stock market's vast and mysterious waters.
The Basics of Chart Patterns
Navigating the Market's Mysterious Map: Definition and Purpose
Chart patterns are the visual representation of the market's heartbeat, capturing the ebbs and flows of supply and demand, as well as the emotions and psychology of traders and investors. These patterns are formed by the price movements of a financial instrument, such as a stock, index, or currency, over a specific period of time.
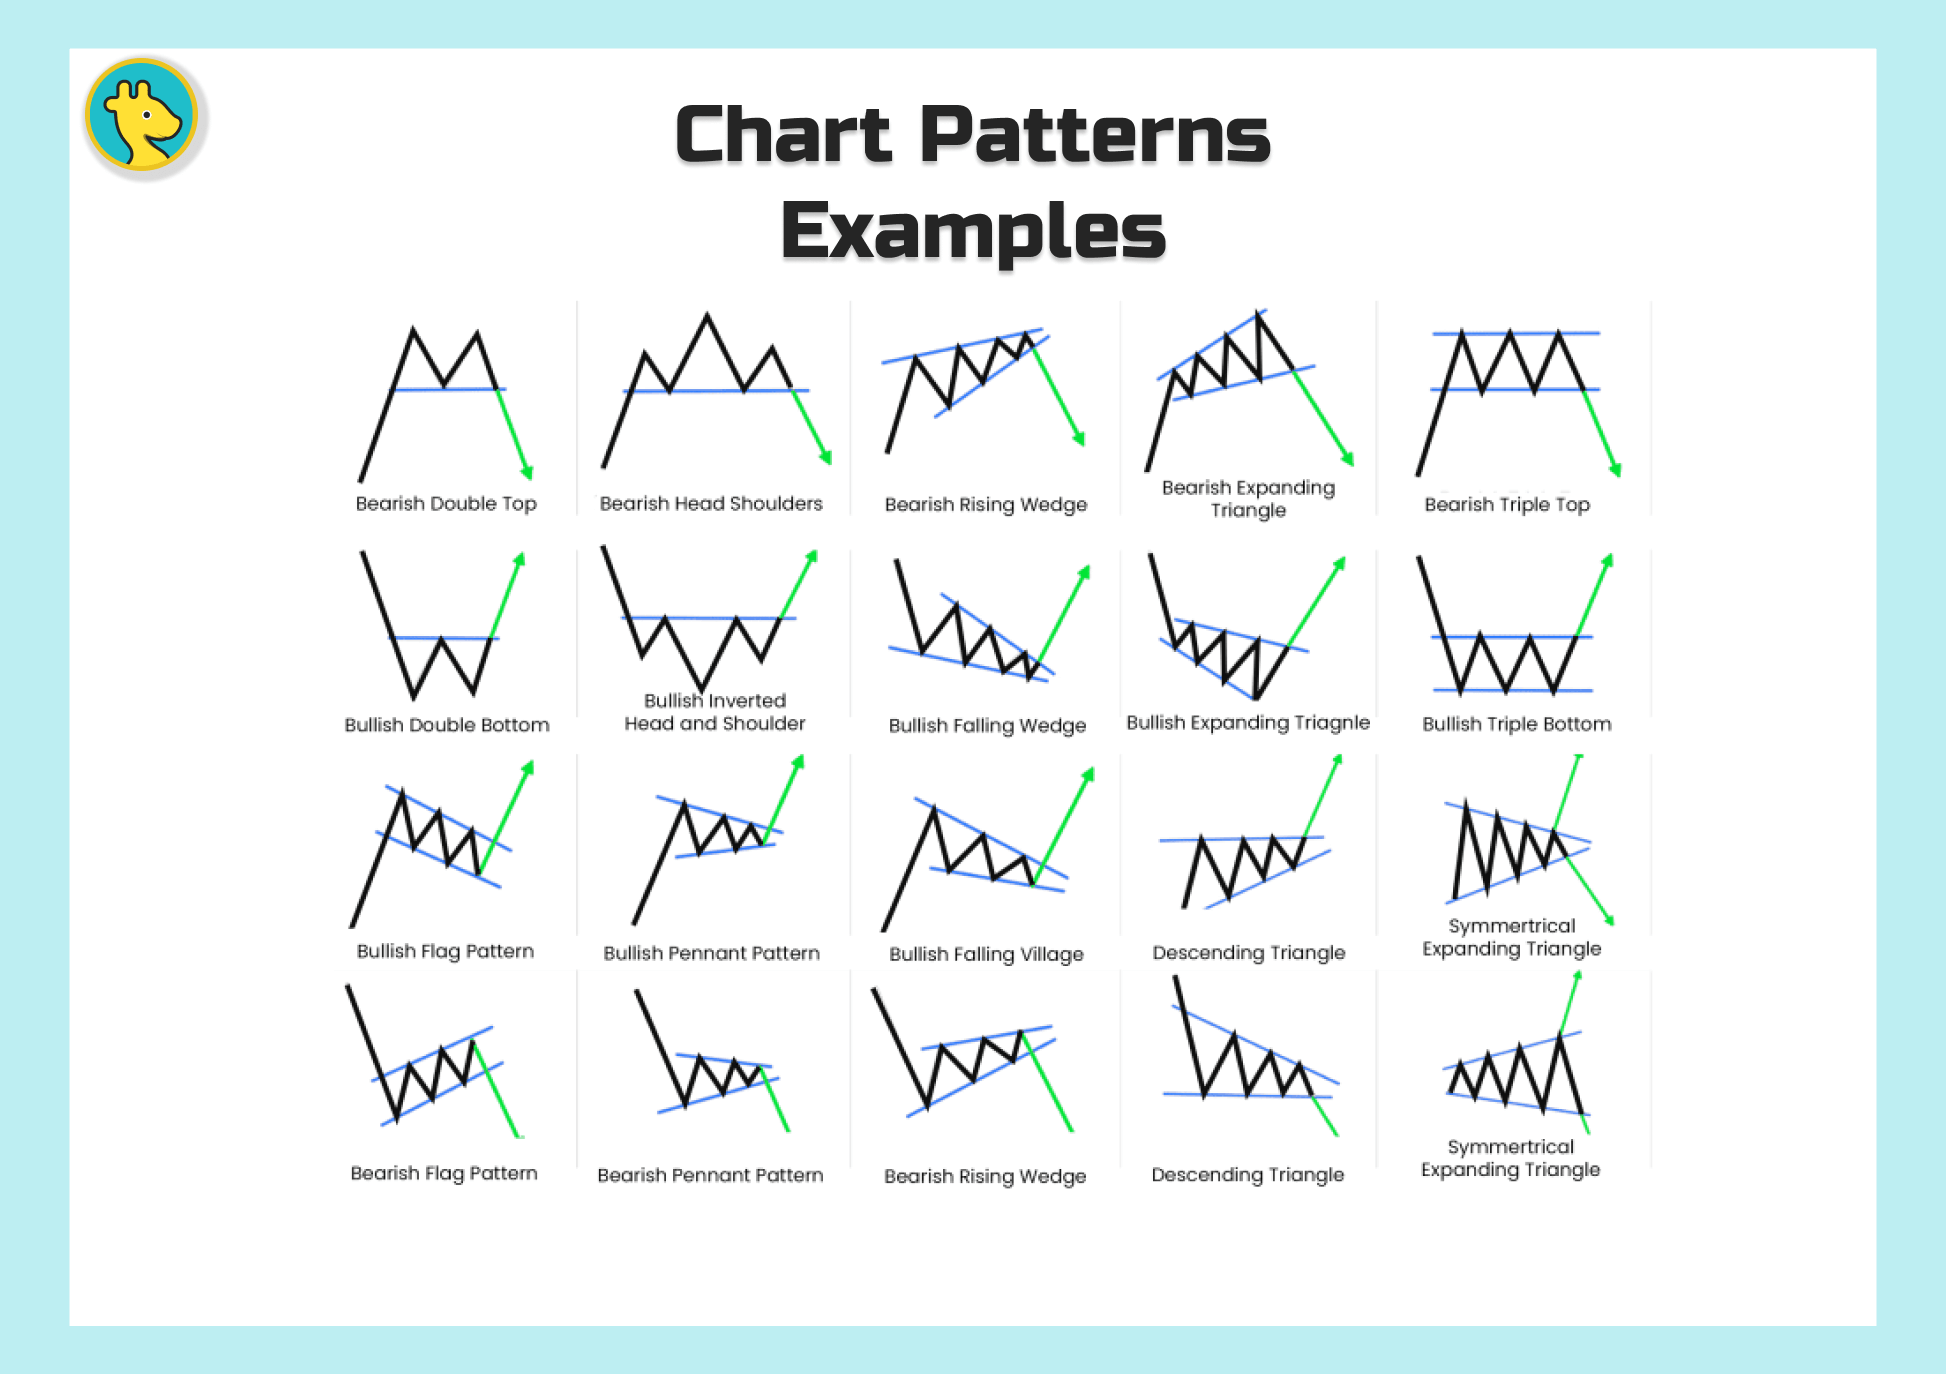
The primary purpose of chart patterns is to help traders and investors identify potential trends and reversals in the market. By analyzing these patterns, market participants can gain insights into how prices may behave in the future, allowing them to make more informed decisions about when to buy, sell, or hold a financial instrument.
In essence, chart patterns are the stock market's unique dialect, a language that reveals the underlying forces and sentiments driving price movements. By learning to interpret and understand these patterns, you'll be better equipped to predict the market's next move, seize profitable opportunities, and ultimately, chart your course to financial success.
A Trader's Trusty Sextant: Importance of Chart Patterns in Technical Analysis
Chart patterns hold a special place in the realm of technical analysis, acting as a vital navigational tool for traders and investors alike. Technical analysis, as opposed to fundamental analysis, primarily focuses on historical price and volume data to predict future market movements. As such, chart patterns play a central role in this methodology, helping traders identify potential entry and exit points, as well as manage risk effectively.
The importance of chart patterns in technical analysis lies in their ability to reveal key insights about the market's behavior and psychology. By observing how these patterns have formed and played out in the past, traders can develop a better understanding of the market's tendencies, allowing them to make more informed decisions and build a sound trading strategy.
Moreover, chart patterns provide traders with an invaluable framework for assessing the strength and validity of various technical indicators. By combining the insights gleaned from chart patterns with other tools, such as trend lines, moving averages, and oscillators, traders can create a more robust and comprehensive analysis of the market's direction and potential opportunities.
In summary, chart patterns are an essential component of technical analysis, serving as a trusty sextant to guide traders through the vast and often treacherous waters of the stock market. By mastering the art of chart pattern interpretation, you'll be well on your way to becoming a proficient navigator in the world of trading.
Charting the Market's Many Faces: Types of Chart Patterns
As you set sail on your trading journey, you'll encounter various types of chart patterns that signal different market scenarios. These patterns can be broadly categorized into three groups: reversal patterns, continuation patterns, and bilateral patterns. Each category serves a unique purpose in helping traders and investors navigate the market's constantly shifting tides.
1. Reversal Patterns:

Reversal patterns signal a potential change in the market's direction. These patterns indicate that the current trend—whether bullish or bearish—is losing momentum and may soon reverse. By identifying these patterns, traders can prepare to capitalize on the impending shift in the market's course. Some common reversal patterns include the Head and Shoulders, Double Top and Double Bottom, and Triple Top and Triple Bottom.
2. Continuation Patterns:
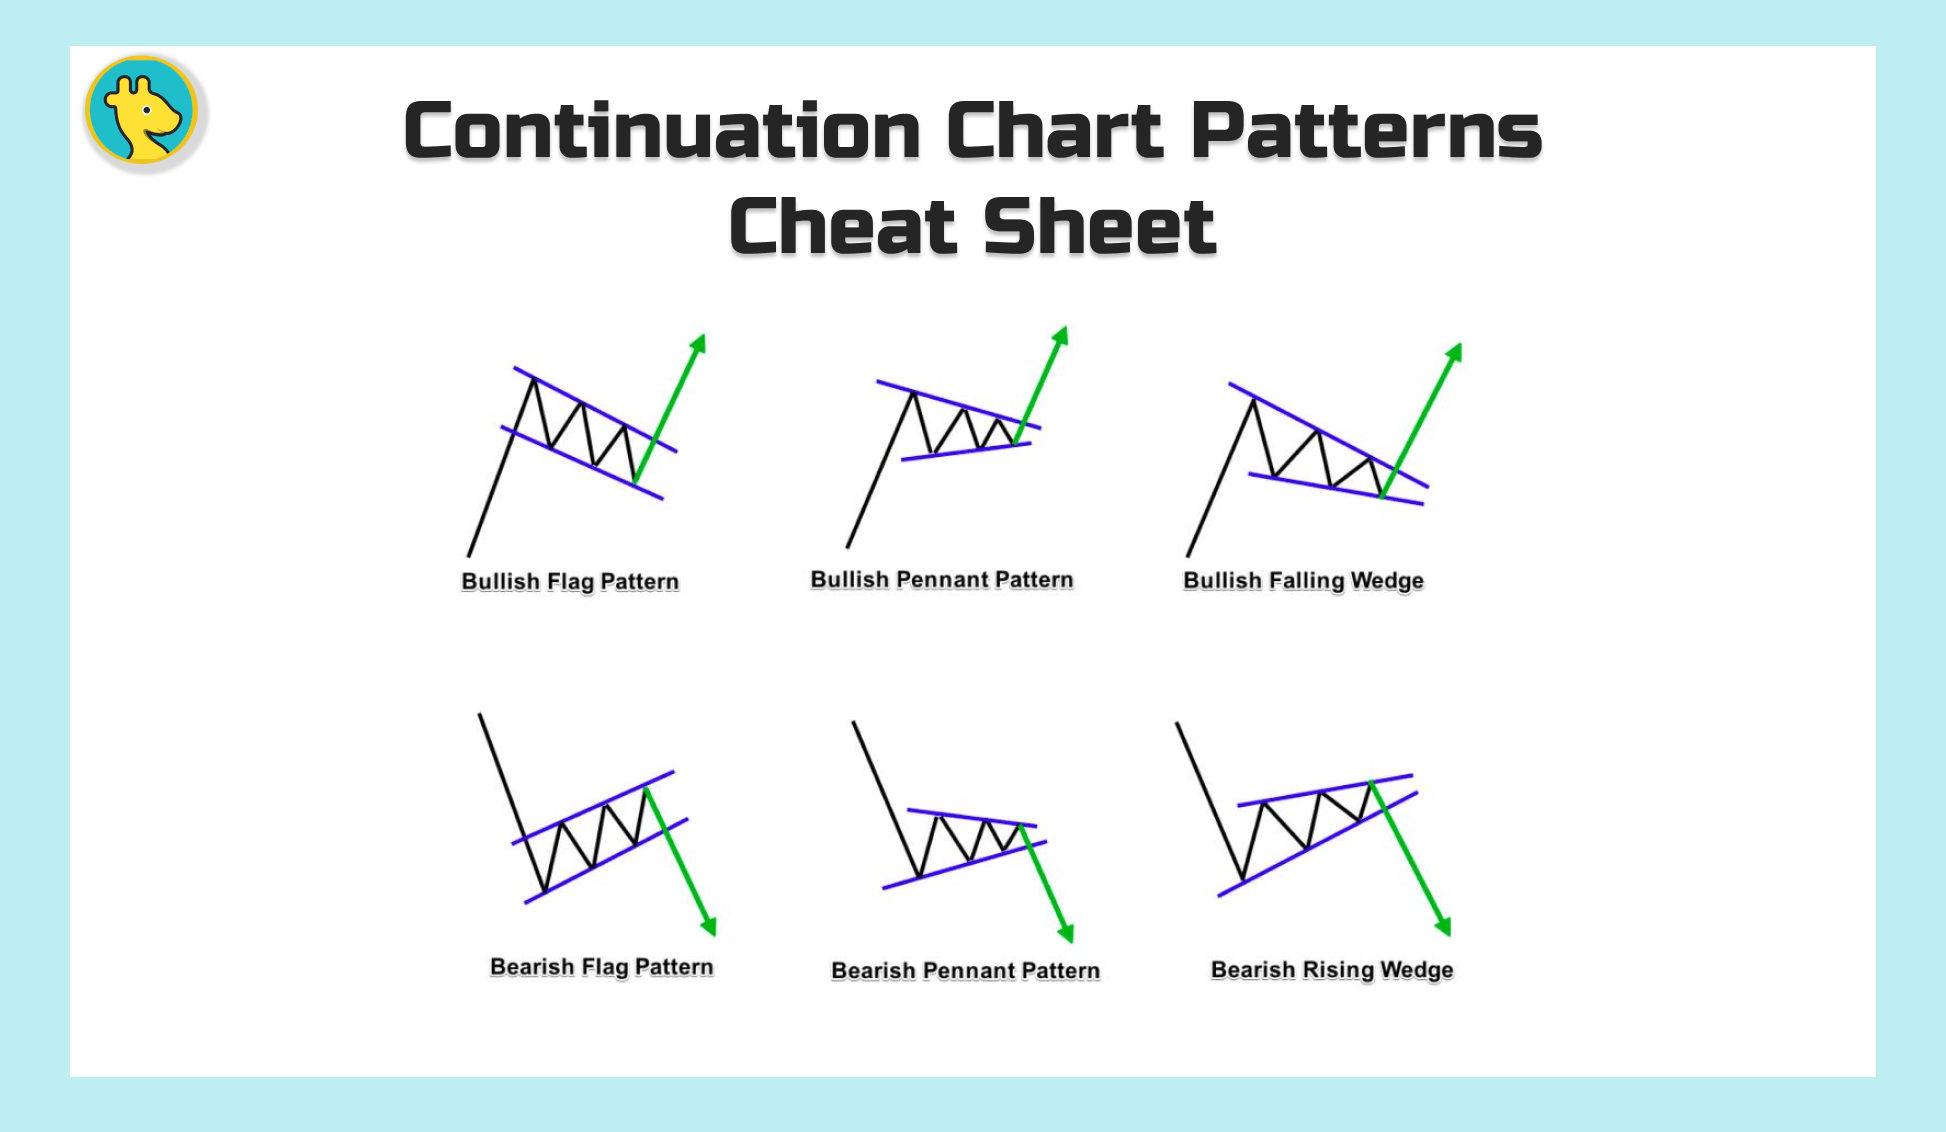
Continuation patterns suggest that the current trend is likely to persist after a brief period of consolidation. These patterns provide traders with an opportunity to add to their existing positions or enter new trades in the direction of the prevailing trend. Common continuation patterns include Flags and Pennants, Rectangles, and Wedges.
3. Bilateral Patterns:
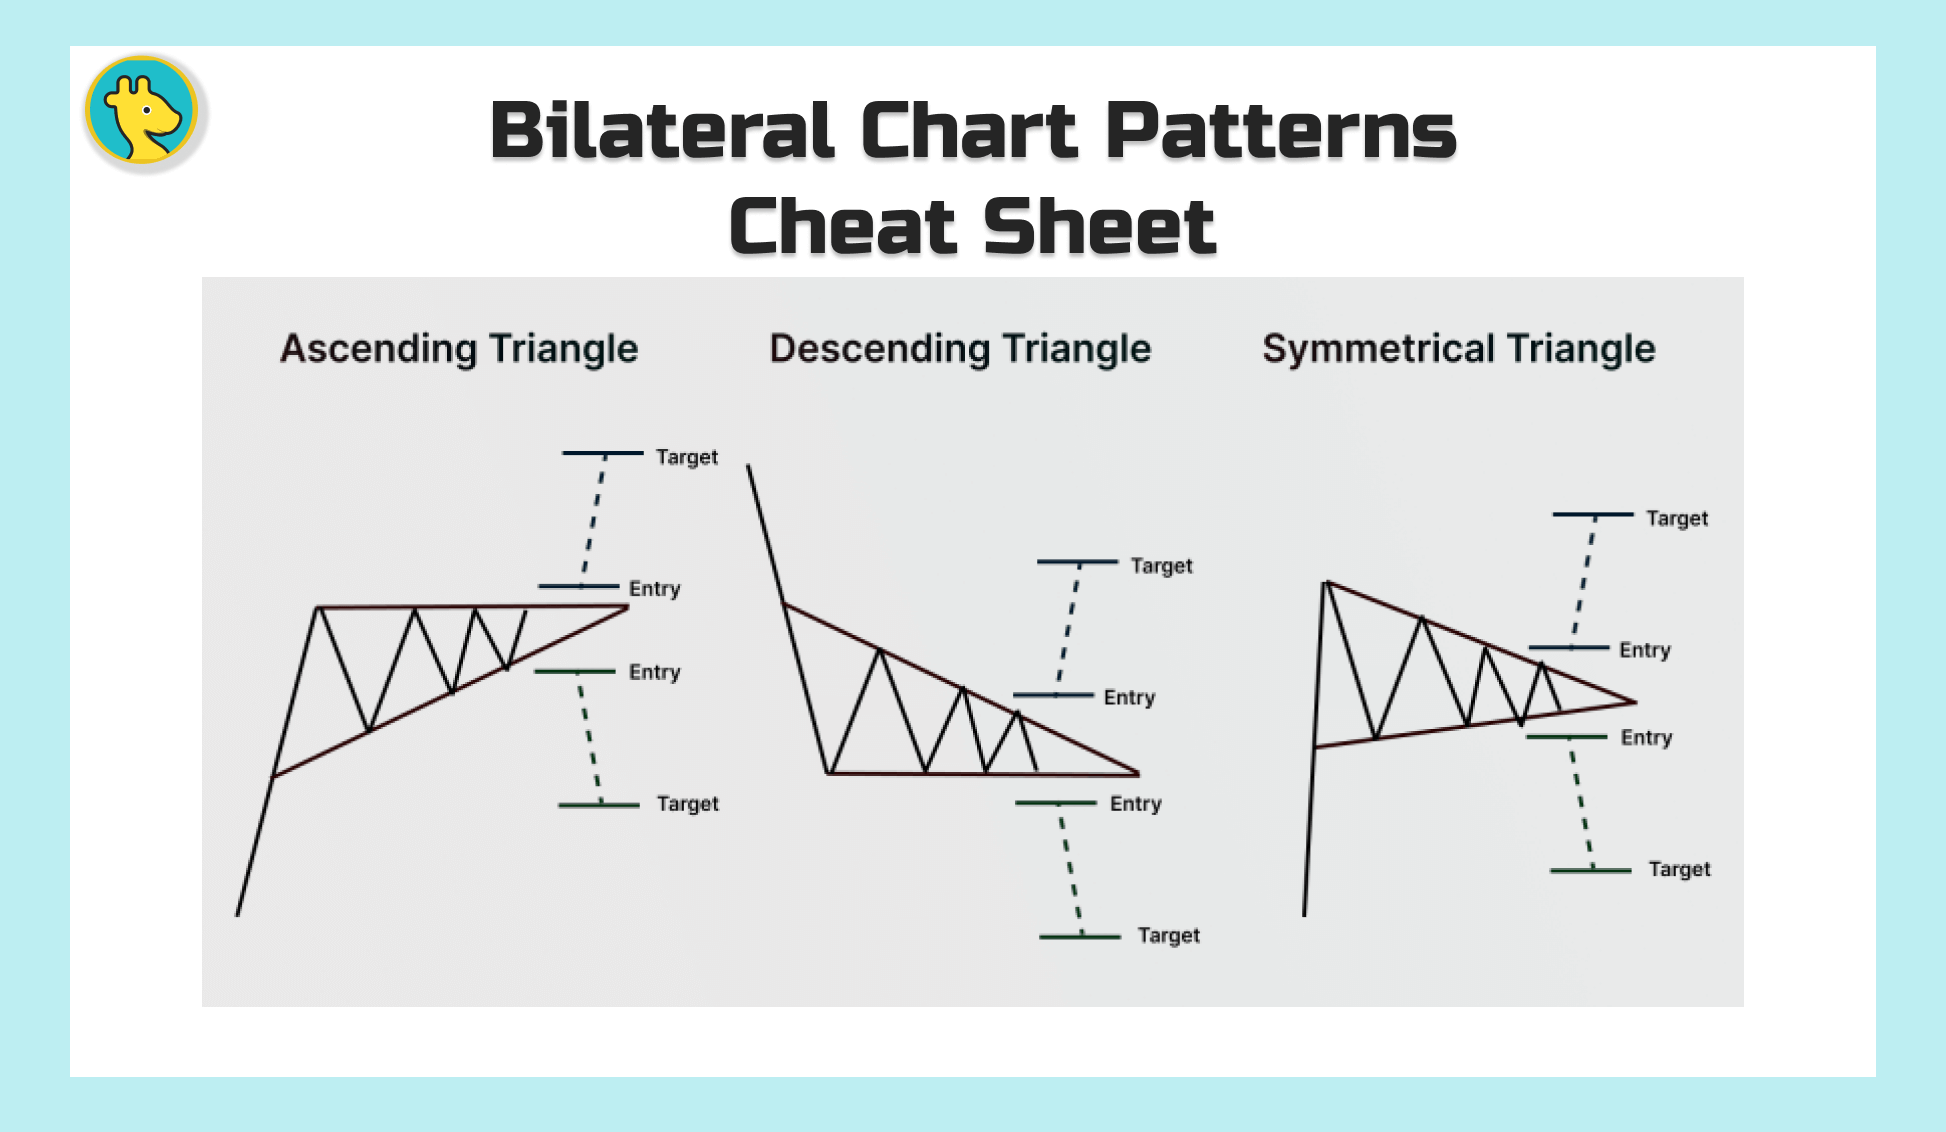
Bilateral patterns are unique in that they don't provide a clear indication of the market's future direction. Instead, these patterns signal that the market is currently in a state of indecision, with the potential to break out in either direction. By recognizing these patterns, traders can prepare for multiple scenarios and adjust their trading strategies accordingly. Examples of bilateral patterns include Symmetrical Triangles, Ascending and Descending Triangles, and the Diamond Pattern.
By familiarizing yourself with these different types of chart patterns, you'll be better equipped to interpret the market's ever-changing landscape and seize opportunities that arise from various market conditions. With the Ultimate Chart Patterns Cheat Sheet as your trusty guide, you'll be well on your way to mastering the art of stock market navigation.
The Ultimate Chart Patterns Cheat Sheet
A. Reversal Patterns: Turning the Tide in the Market
1. Head and Shoulders:
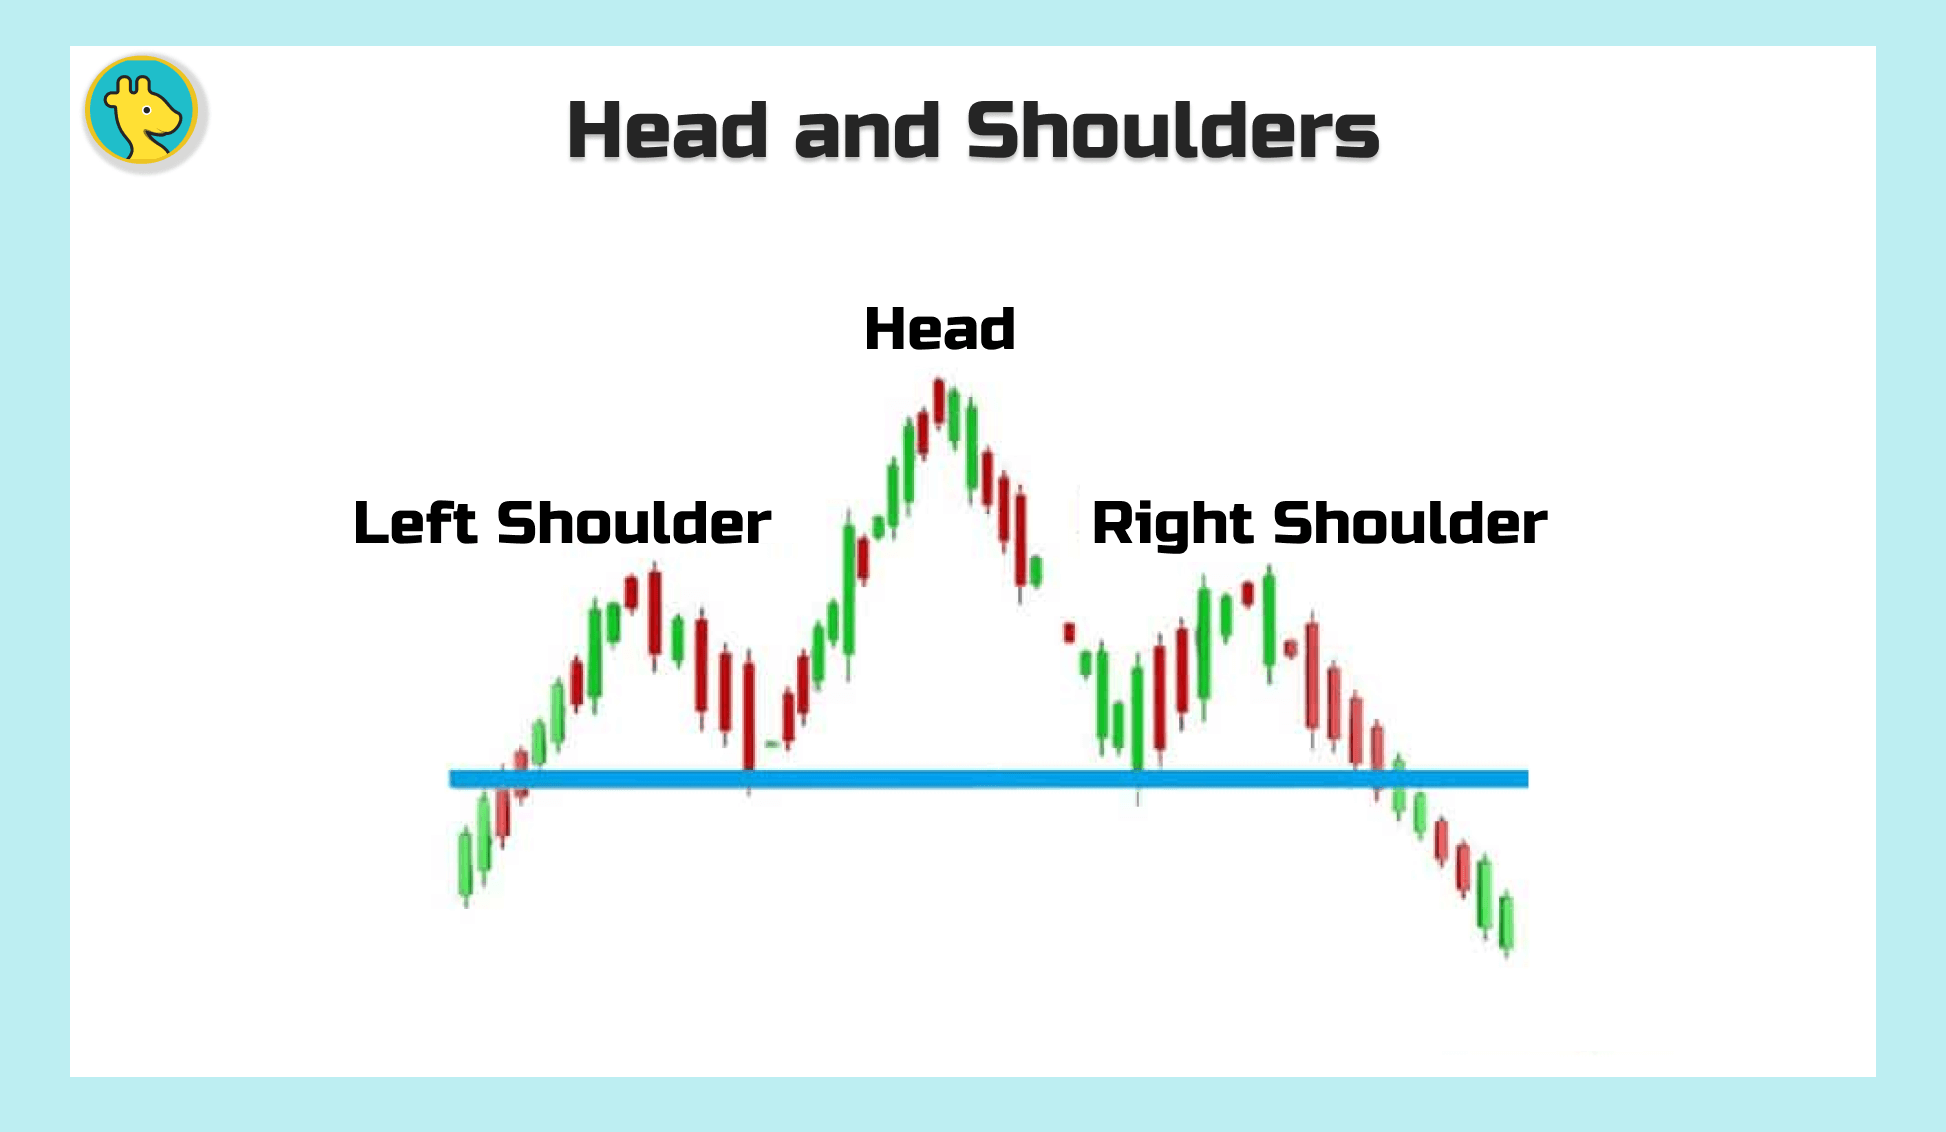
The Head and Shoulders pattern is a classic reversal pattern that signals a bearish reversal after an uptrend. It consists of three peaks, with the middle peak (the "head") being the highest and the two surrounding peaks (the "shoulders") being lower. The pattern is completed when the price breaks below the "neckline" that connects the lows between the shoulders. Conversely, the Inverse Head and Shoulders pattern indicates a bullish reversal after a downtrend.
2. Double Top and Double Bottom:
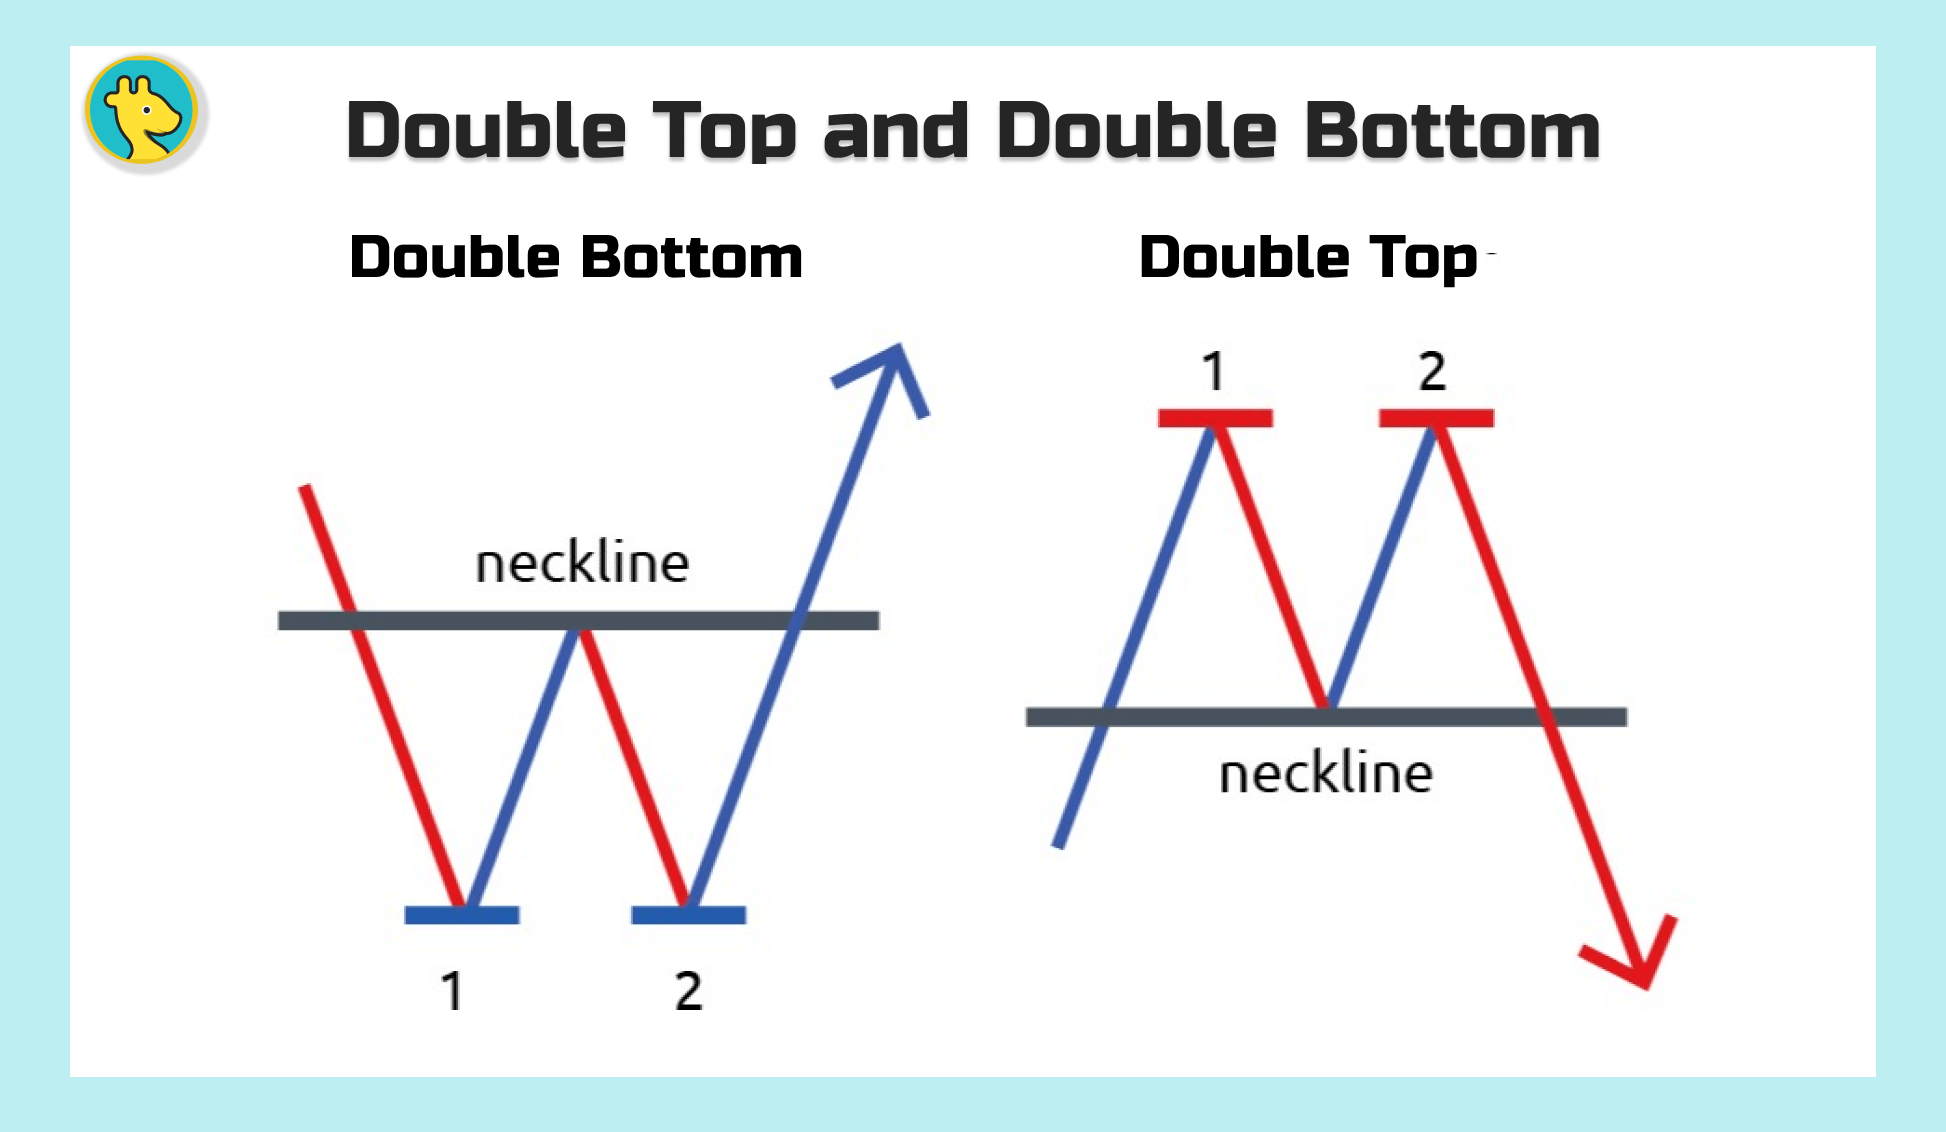
The Double Top pattern is formed when the price reaches the same resistance level twice and fails to break through, signaling a bearish reversal. This pattern resembles the letter "M." On the other hand, the Double Bottom pattern occurs when the price reaches the same support level twice and bounces back, signaling a bullish reversal. This pattern resembles the letter "W."
3. Triple Top and Triple Bottom:

Similar to the Double Top and Double Bottom patterns, the Triple Top pattern occurs when the price reaches the same resistance level three times and fails to break through, indicating a bearish reversal. The Triple Bottom pattern, conversely, takes place when the price reaches the same support level three times and bounces back, signaling a bullish reversal.
4. Rounded Top and Rounded Bottom:
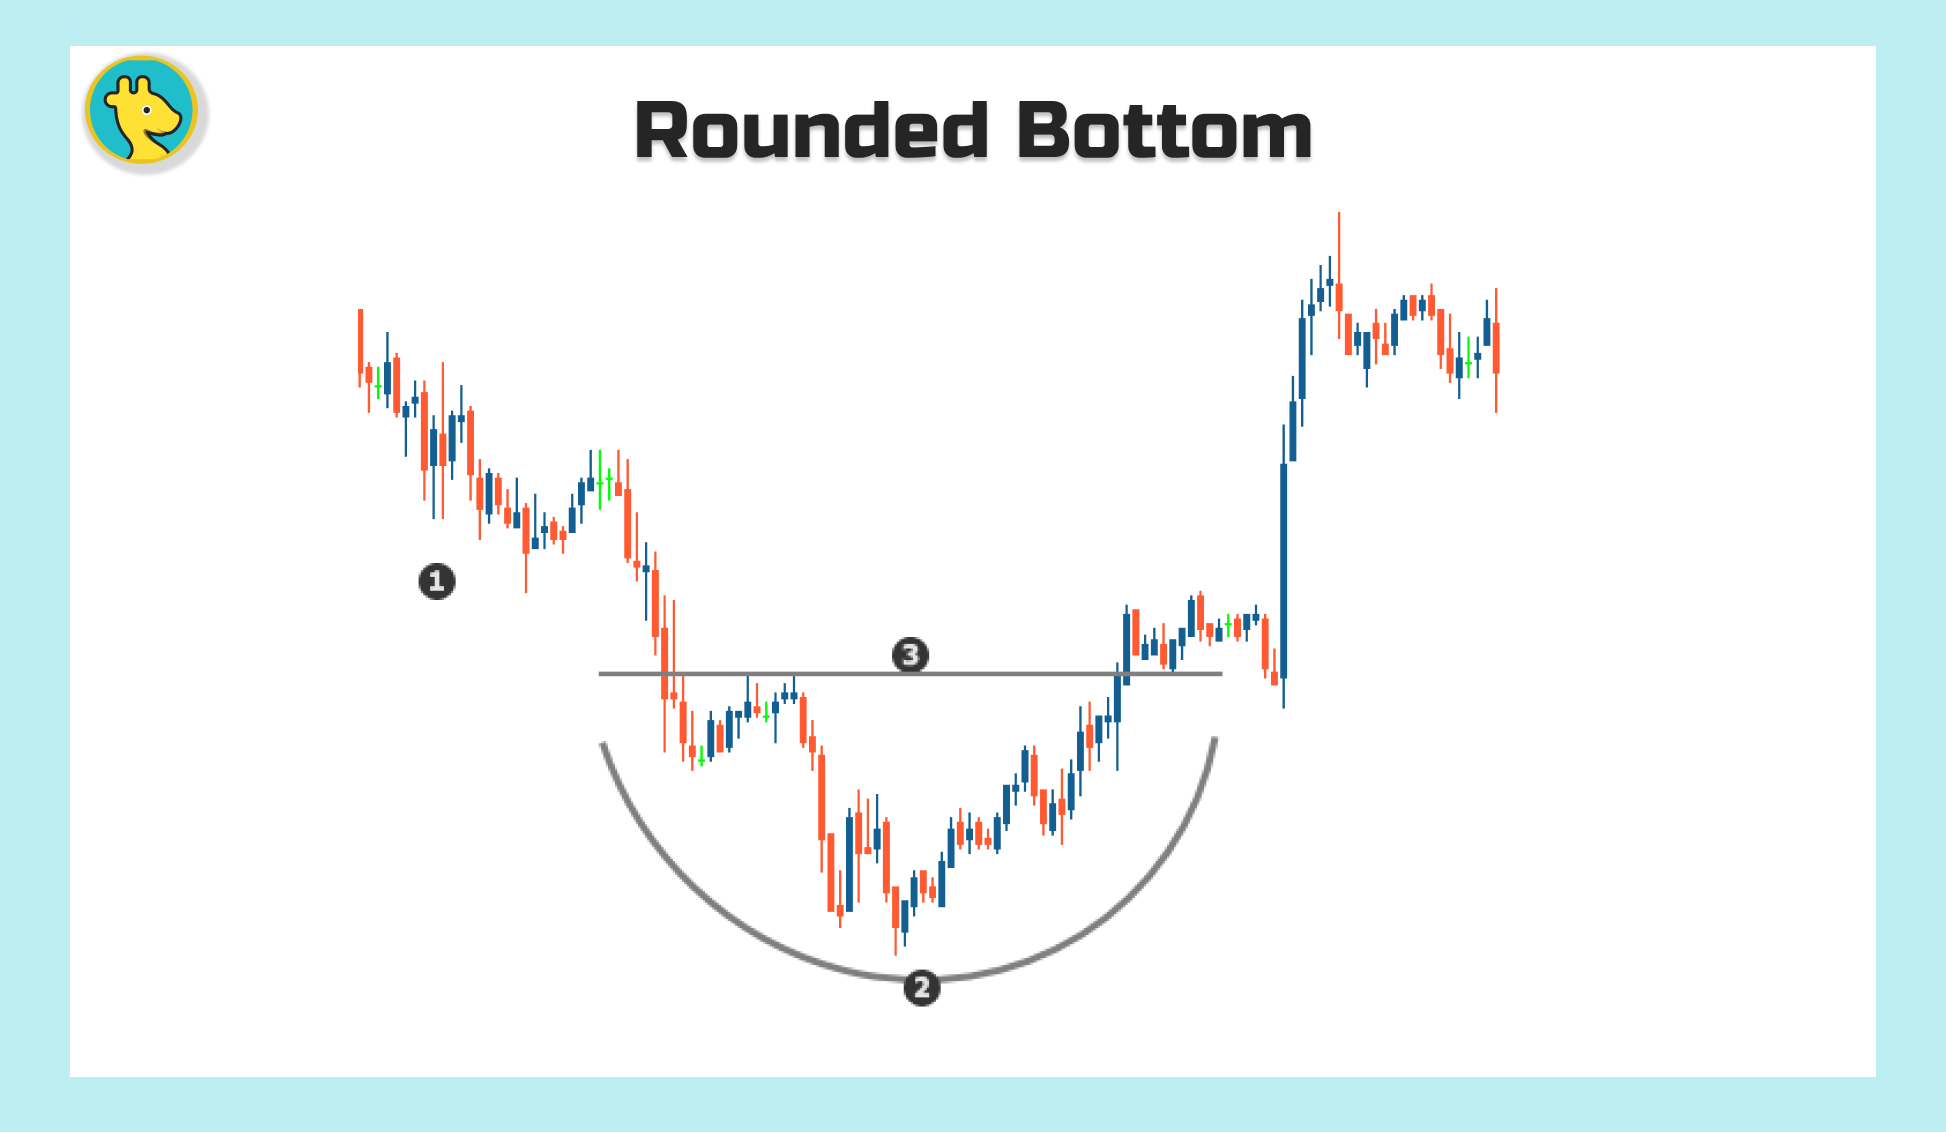
The Rounded Top pattern is a bearish reversal pattern that forms gradually over time, as buying pressure decreases and the price starts to decline. This pattern is characterized by a rounded, dome-like shape at the top of an uptrend. The Rounded Bottom pattern, on the other hand, is a bullish reversal pattern that occurs at the end of a downtrend. It is characterized by a rounded, bowl-like shape, indicating that selling pressure is diminishing and the price is starting to rise.
By mastering these reversal patterns, you'll be able to spot potential trend reversals and adjust your trading strategy accordingly. The Ultimate Chart Patterns Cheat Sheet will help you identify and decipher these key patterns, empowering you to make well-informed decisions and capitalize on market shifts.
B. Continuation Patterns: Riding the Waves of Market Momentum
1. Flags and Pennants:

Flags and Pennants are short-term continuation patterns that signal a brief pause in the prevailing trend before resuming in the same direction. Flags resemble a small parallelogram sloping against the trend, while Pennants look like small symmetrical triangles. Both patterns are preceded by a sharp price movement, known as the "flagpole" or "mast," and are confirmed when the price breaks out in the direction of the prevailing trend.
2. Rectangles:
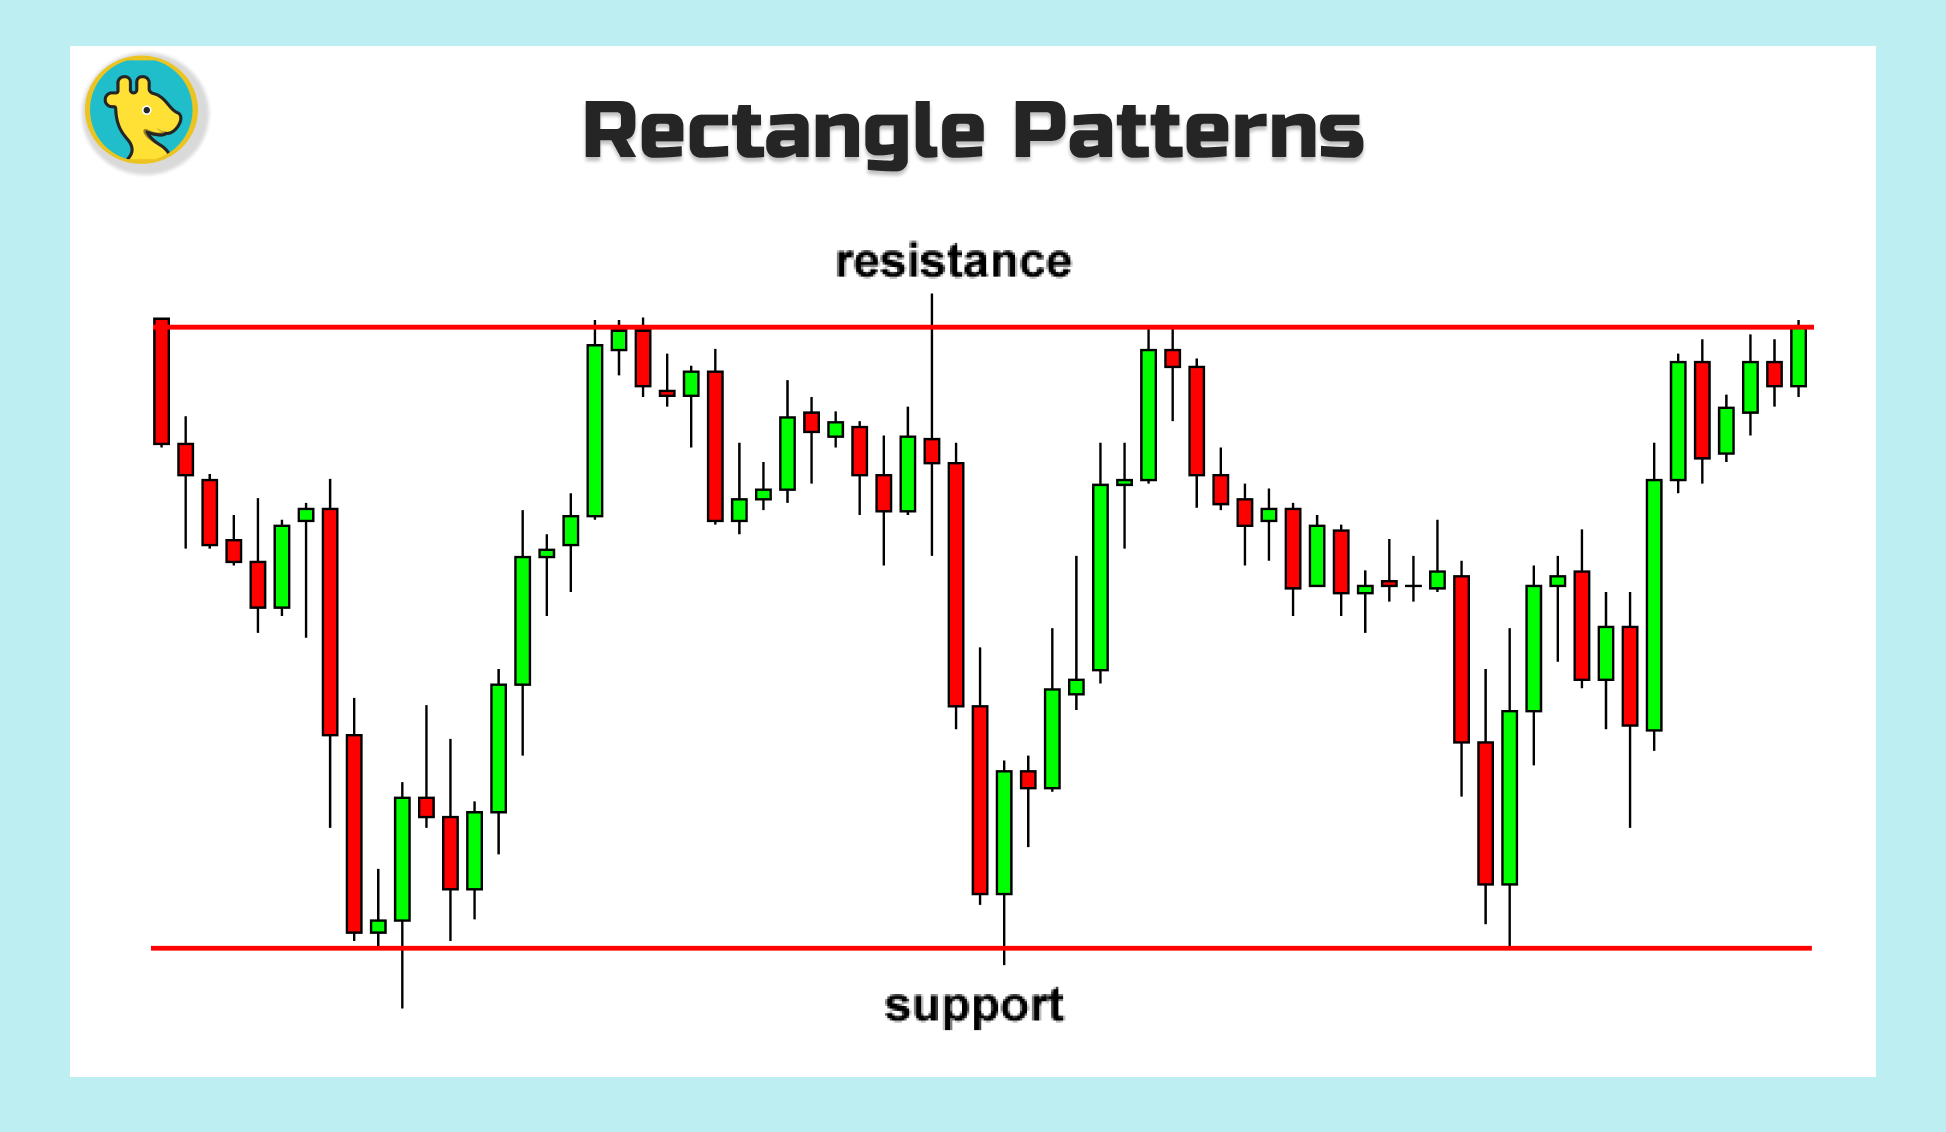
The Rectangle pattern forms when the price consolidates within a horizontal trading range, bouncing between parallel support and resistance levels. This pattern is considered a continuation pattern, as it typically indicates that the market is taking a breather before continuing in the direction of the prevailing trend. A breakout above or below the trading range confirms the continuation of the trend.
3. Wedges:

Wedges are formed when the price consolidates between two converging trendlines, with one being upward sloping and the other downward sloping. There are two types of wedges: Rising Wedges and Falling Wedges. Rising Wedges are typically bearish continuation patterns that occur during a downtrend, while Falling Wedges are usually bullish continuation patterns that form during an uptrend. The pattern is confirmed when the price breaks through the converging trendlines in the direction of the prevailing trend.
4. Cup and Handle:
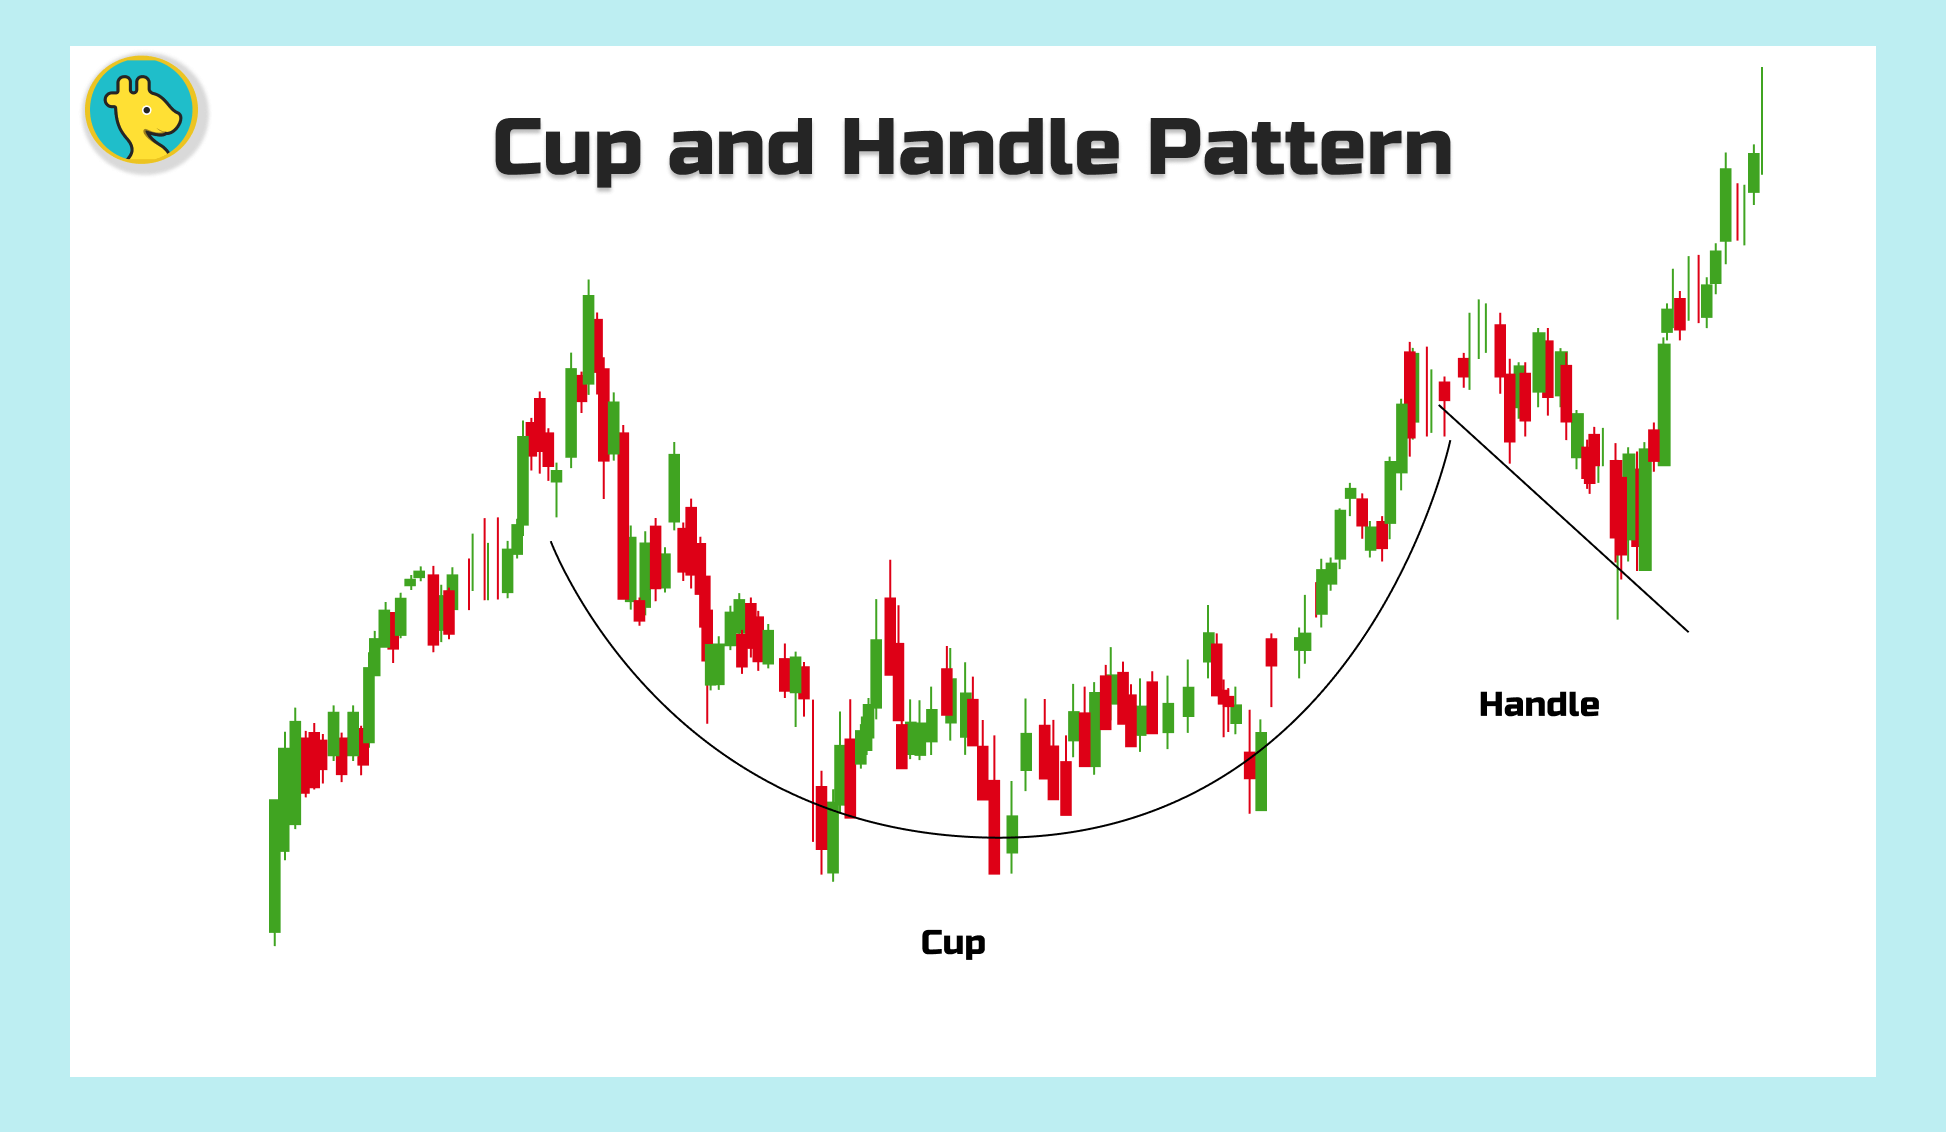
The Cup and Handle pattern is a bullish continuation pattern that resembles a tea cup with a handle. The "cup" part of the pattern forms when the price follows a rounded, bowl-like shape before reaching the same resistance level twice. The "handle" forms as a small, downward-sloping consolidation after the cup. The pattern is confirmed when the price breaks above the resistance level, indicating that the uptrend is likely to continue.
By learning to recognize these continuation patterns, you'll be able to identify opportunities to ride the momentum of the prevailing trend and make more informed trading decisions. The Ultimate Chart Patterns Cheat Sheet is your go-to resource for spotting and interpreting these crucial patterns, giving you the confidence to navigate the ever-changing market landscape.
C. Bilateral Patterns: The Market's Wild Card
1. Symmetrical Triangles:
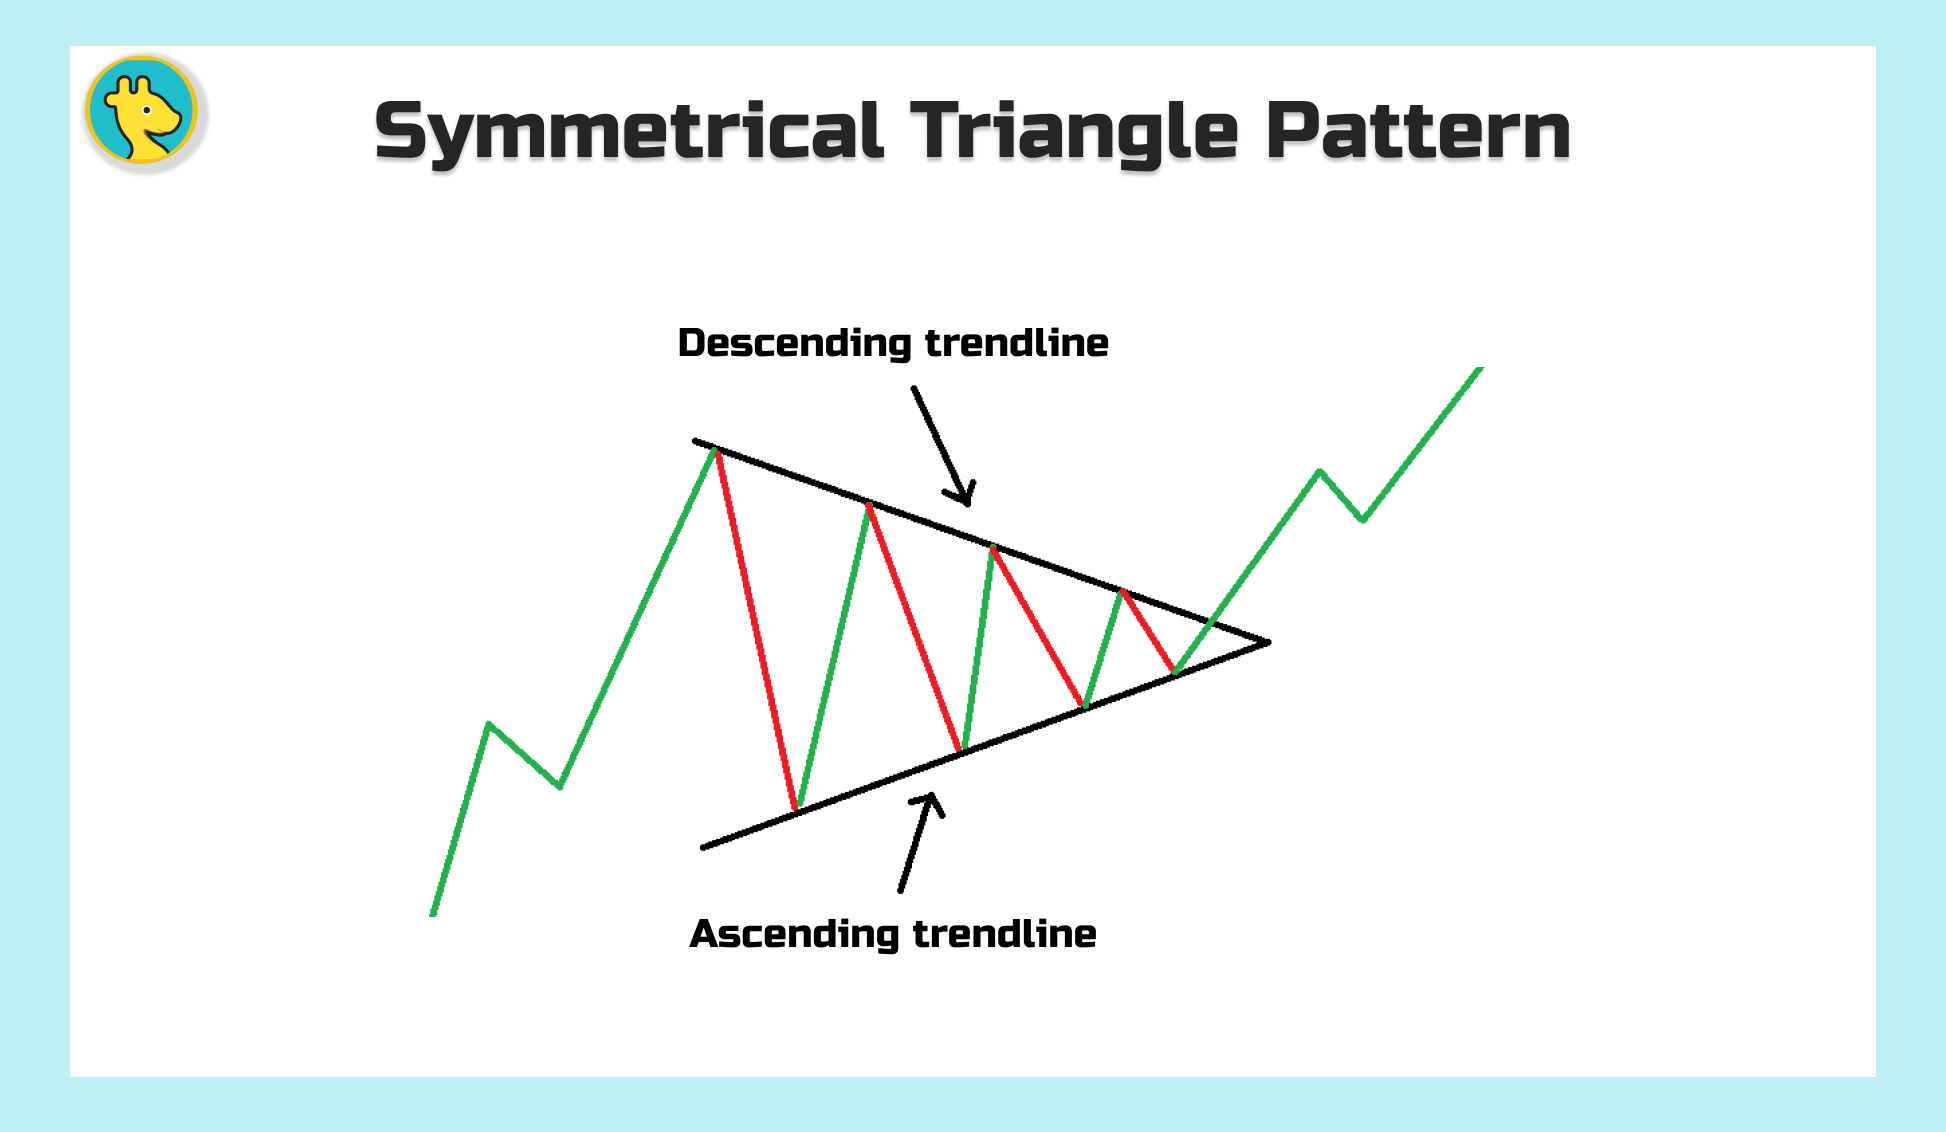
Symmetrical Triangles are like a game of tug-of-war between bulls and bears, with both sides pulling with equal force. These patterns are formed when the price moves within converging trendlines, creating a series of lower highs and higher lows. As the price action tightens, the market awaits a breakout in either direction. Keep a close eye on this standoff, because once the price breaks through one of the trendlines, it can signal a significant move in that direction.
2. Ascending and Descending Triangles:
Ascending and Descending Triangles are sibling patterns with a knack for keeping traders on their toes. The Ascending Triangle has a flat upper trendline and an upward-sloping lower trendline, while the Descending Triangle has a flat lower trendline and a downward-sloping upper trendline. Both patterns signal a period of consolidation and can break out in either direction. Like a suspenseful movie, you'll be at the edge of your seat, waiting to see how these triangles play out in the market.
3. Diamond Pattern:
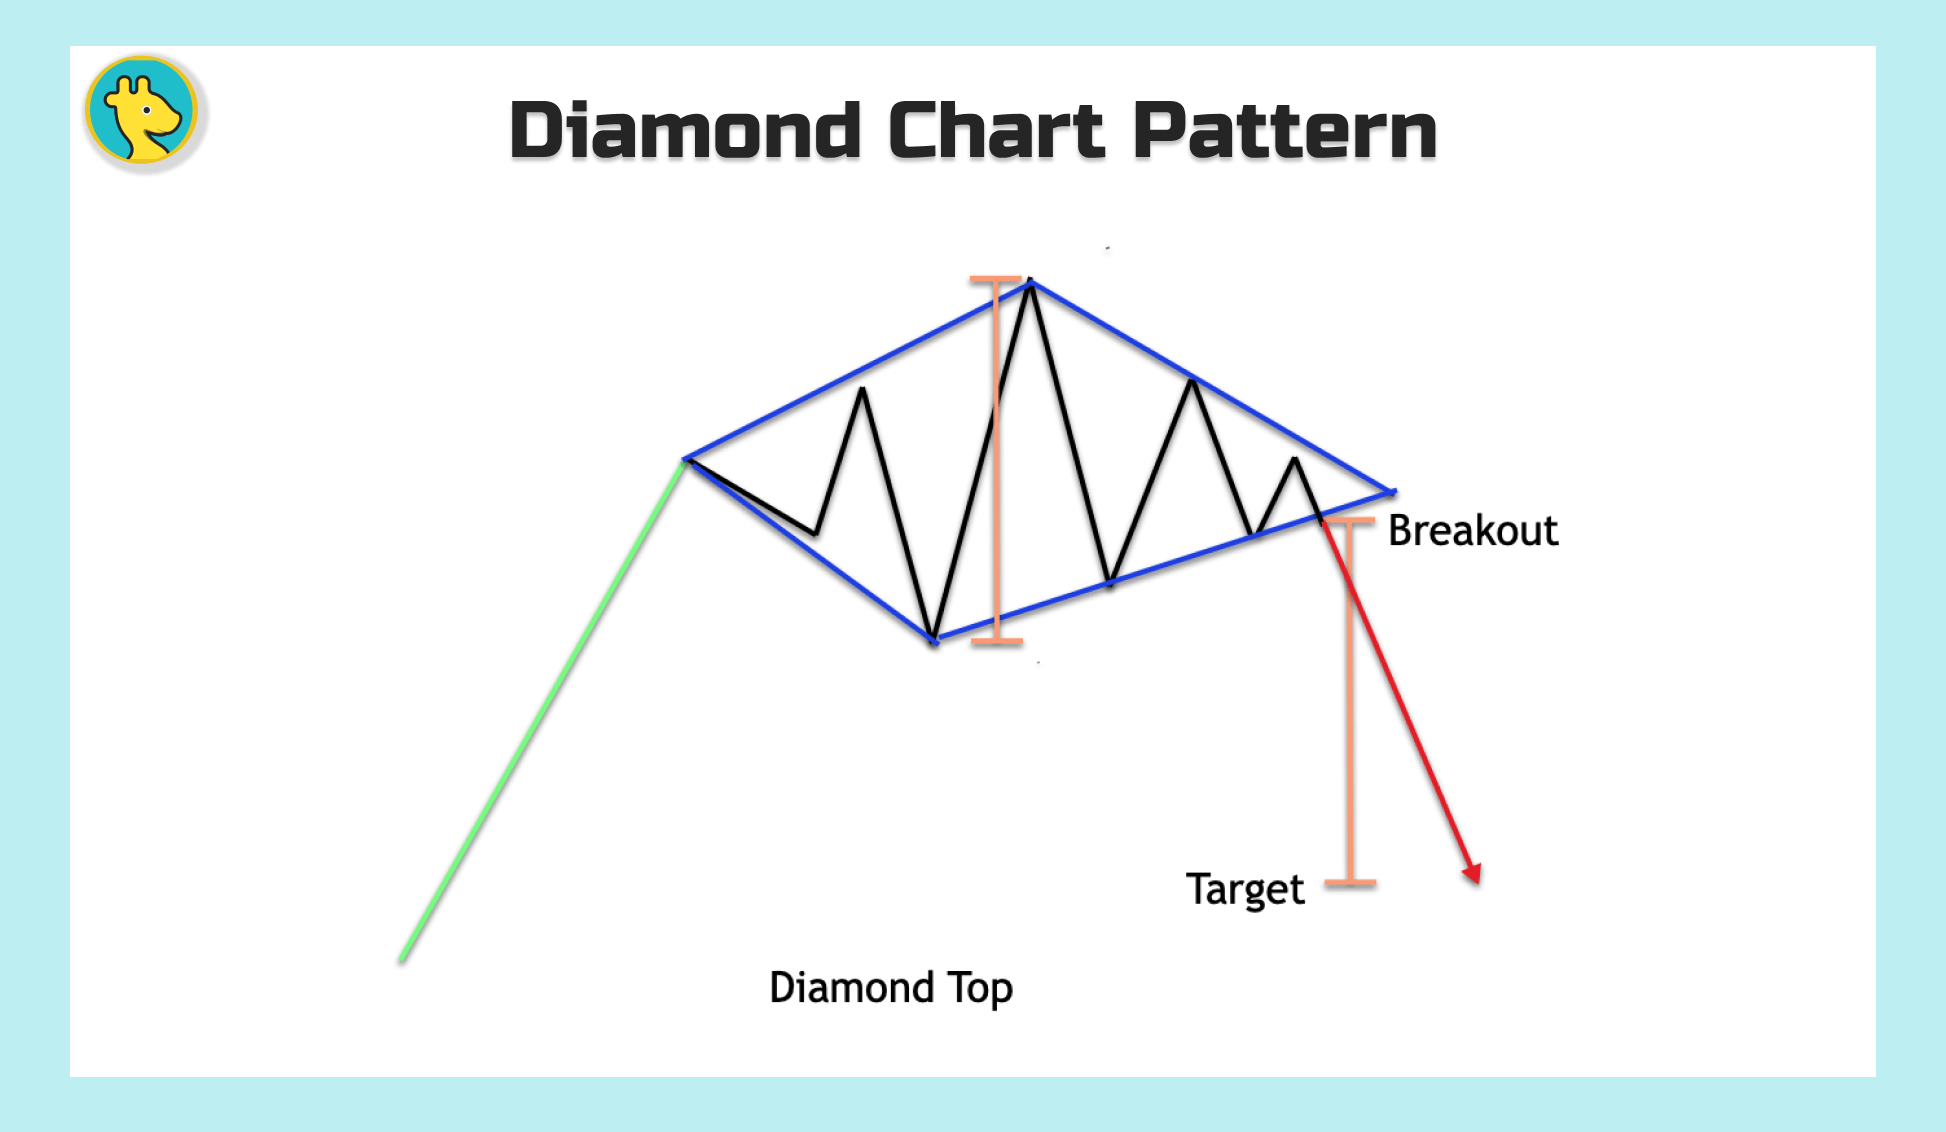
The Diamond Pattern is a rare gem in the world of chart patterns, signaling a potential reversal or continuation in the market. This pattern forms when the price moves within two sets of converging trendlines, creating a diamond shape. The Diamond Pattern's unpredictability adds an element of excitement to the trading game, as the market can break out in either direction. Keep your eyes peeled for this elusive pattern, because when it shows up, it's bound to make a splash.
By getting acquainted with these bilateral patterns, you'll be ready to adapt your trading strategy to the market's ever-changing conditions. The Ultimate Chart Patterns Cheat Sheet will be your trusty sidekick, helping you identify and interpret these patterns as you chart your course through the stock market's unpredictable waters.
Tips for Identifying Chart Patterns: The Trader's Treasure Map
1. Timeframes:
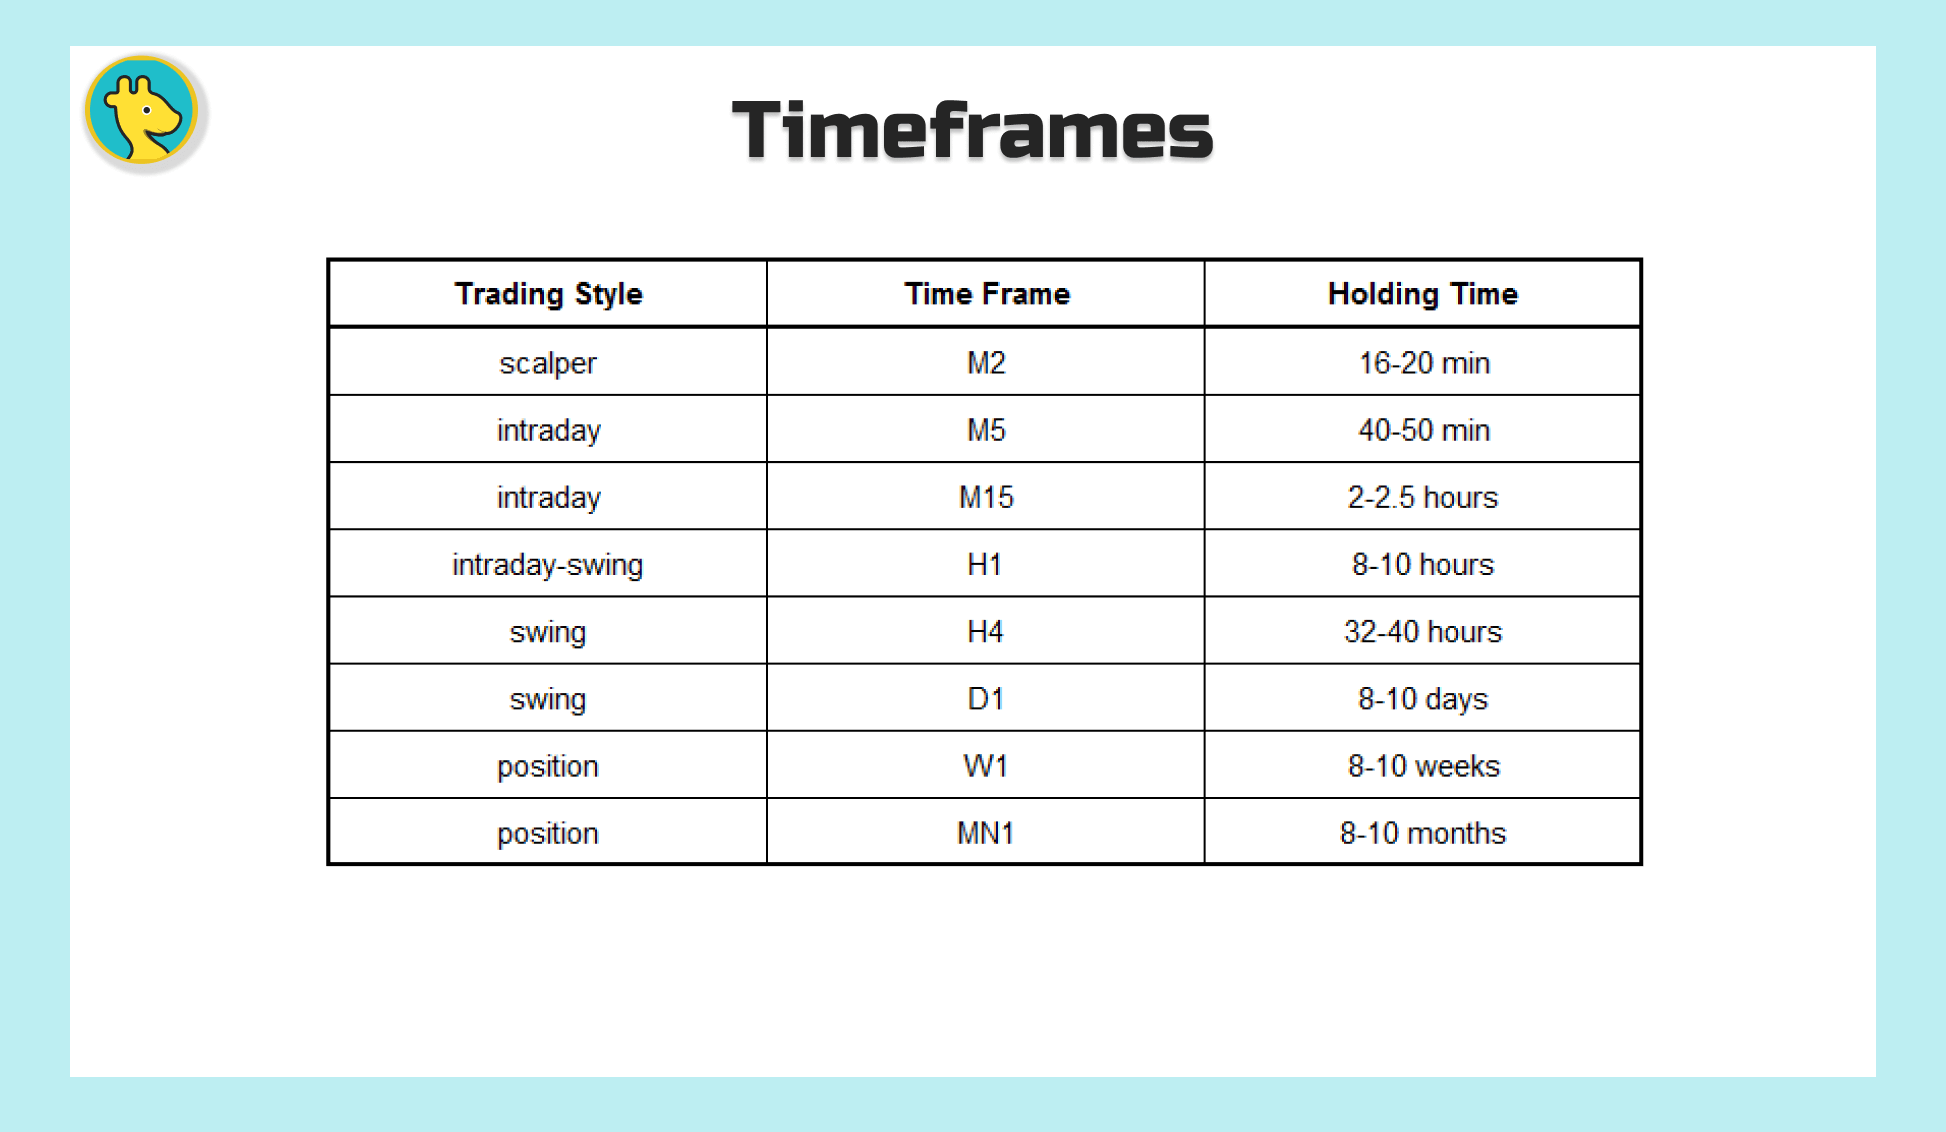
In the world of trading, time is money, and choosing the right timeframe can make all the difference. Analyzing multiple timeframes can provide valuable insights into the market's behavior and help you spot chart patterns more effectively. Don't be afraid to zoom in and out, from shorter timeframes like minutes and hours to longer ones like days and weeks. By gaining a broader perspective, you'll be better equipped to navigate the market's ever-changing landscape.
2. Volume Analysis:
Volume is the lifeblood of the market, and analyzing it can give you an edge in identifying chart patterns. Keep an eye on volume spikes, as they can signal significant market interest in a particular price level. This additional layer of information can help you confirm the strength and validity of chart patterns, making it easier to spot genuine trading opportunities.
3. Support and Resistance Levels:
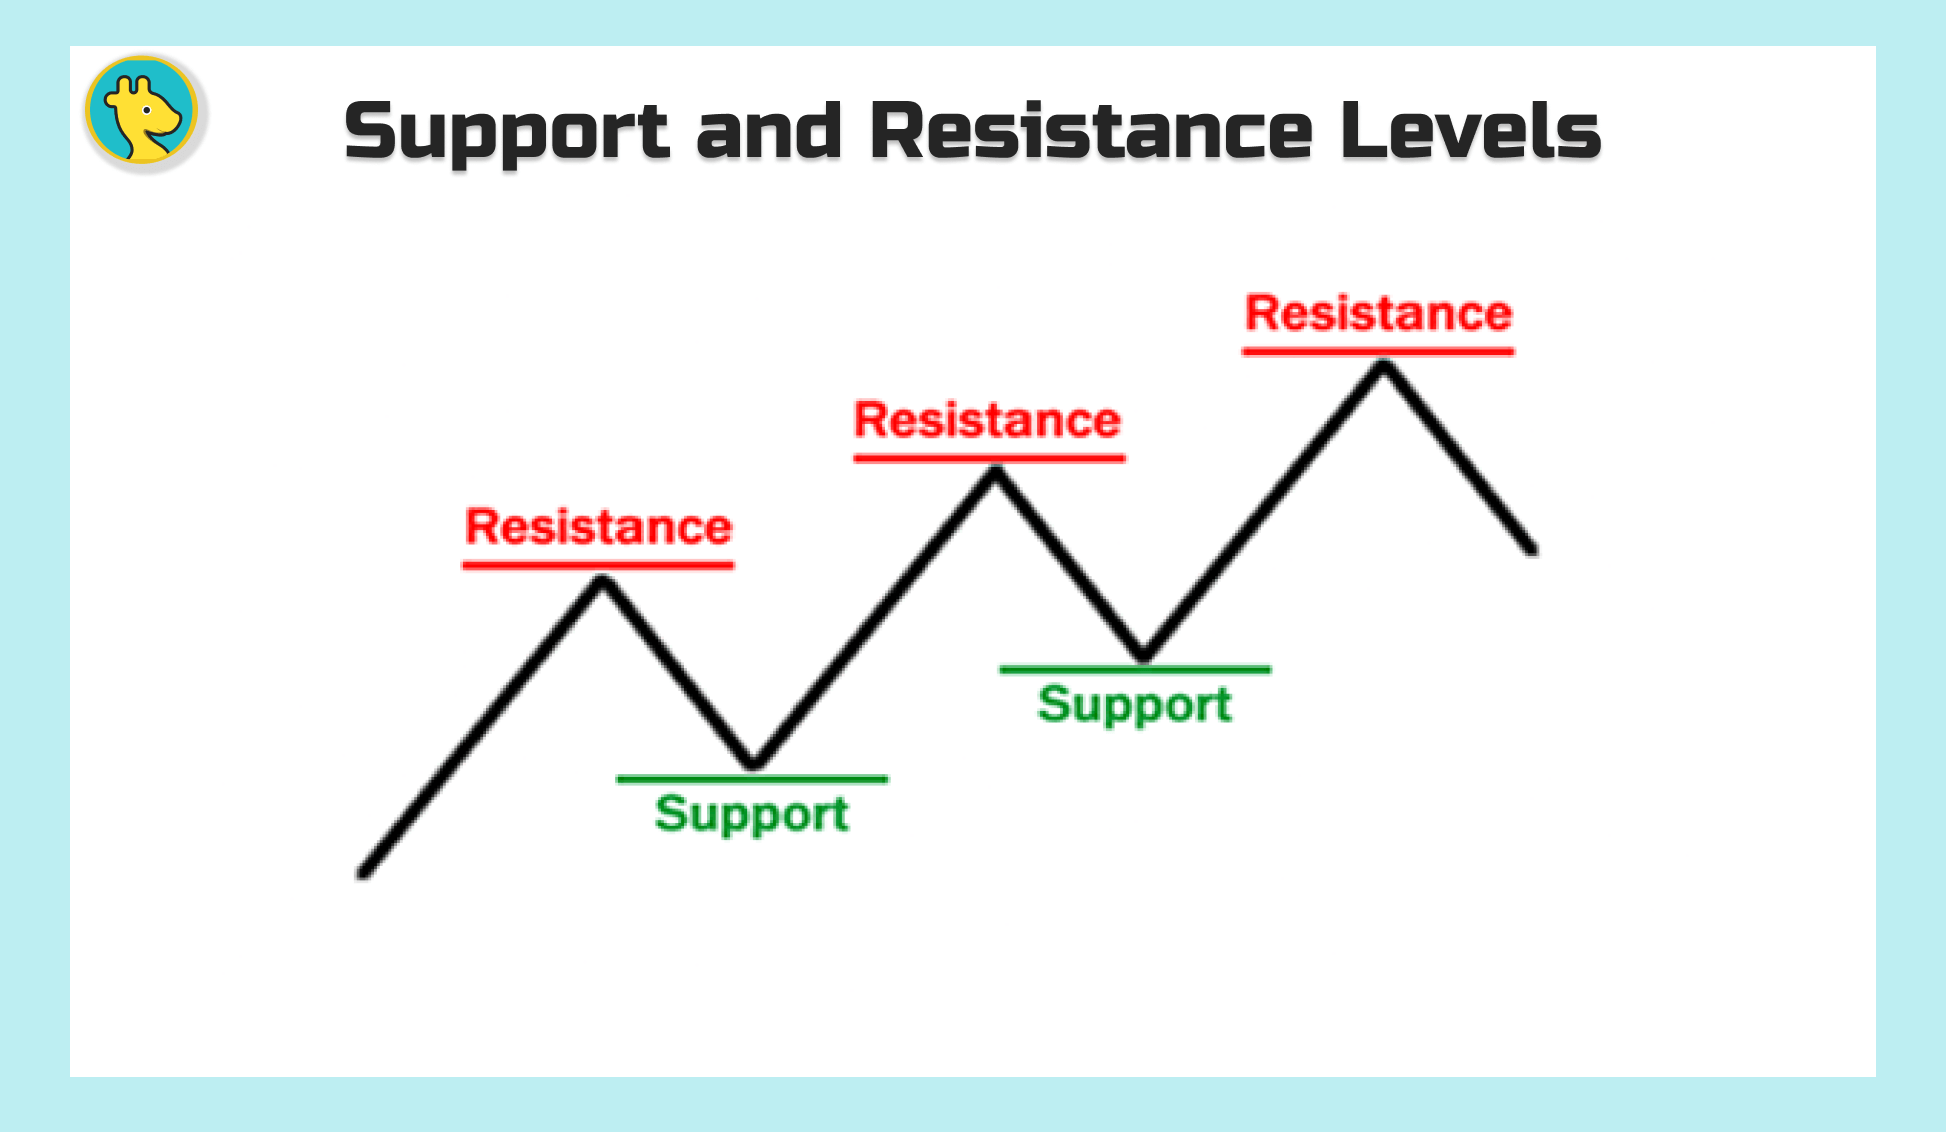
Support and resistance levels are like the market's psychological landmarks, providing traders with key reference points for making decisions. Pay close attention to these levels when analyzing chart patterns, as they can help you identify potential entry and exit points, as well as stop-loss placements. The more times a support or resistance level is tested, the more significant it becomes, so keep your eyes peeled for these crucial market markers.
4. Utilizing Trading Software:
In today's fast-paced trading environment, having the right tools can give you a competitive edge. Utilizing trading software can help you spot chart patterns more efficiently and accurately. Many trading platforms offer charting tools and indicators that can make it easier to identify and analyze patterns. Don't be afraid to experiment with different tools and settings to find the perfect combination for your trading style and strategy.
By following these tips and honing your skills, you'll become a master at identifying chart patterns and harnessing the power of the Ultimate Chart Patterns Cheat Sheet. With a keen eye and a trusty set of tools, you'll be well on your way to navigating the stock market's unpredictable waters with confidence and precision.
Putting It All Together: Charting Your Course to Trading Success
Developing a Trading Strategy
A solid trading strategy is the backbone of successful trading, and incorporating chart patterns into your plan is a smart move. Start by identifying your trading goals, preferred timeframe, and risk tolerance. Then, decide which chart patterns align best with your objectives and style. Remember, there's no one-size-fits-all approach, so be prepared to fine-tune your strategy as you gain experience and learn from the market.
Importance of Practice and Patience
Trading, like any skill, takes time and practice to master. As you begin to incorporate chart patterns into your trading, be patient with yourself and remember that even the most experienced traders encounter bumps in the road. Embrace the learning process and consider using a demo account or paper trading to practice identifying and trading chart patterns without risking real money. The more you practice, the more confident and skilled you'll become.
Combining Chart Patterns with Other Technical Indicator
Chart patterns are powerful tools, but they shouldn't be used in isolation. Combining them with other technical indicators, such as moving averages, trend lines, and oscillators, can provide a more comprehensive view of the market and help you make better-informed trading decisions. By using a holistic approach, you'll be better equipped to navigate the market's twists and turns.
Managing Risk and Emotions
Trading can be an emotional roller coaster, and managing risk is crucial for long-term success. Using chart patterns can help you identify potential entry and exit points, as well as set appropriate stop-loss levels. Always have a clear plan for each trade, and be prepared to stick to it, even when emotions are running high. By managing risk and keeping your emotions in check, you'll be better positioned to weather the inevitable ups and downs of the market.
By putting these pieces together and harnessing the power of chart patterns, you'll be well on your way to becoming a more skilled and confident trader. With practice, patience, and the Ultimate Chart Patterns Cheat Sheet by your side, you'll be ready to tackle the stock market's ever-changing landscape and chart your course to success.
Conclusion: Chart Patterns - Your Ticket to Trading Triumph
Throughout this journey, we've explored the world of chart patterns, delving into reversal, continuation, and bilateral patterns. We've also discussed tips for identifying patterns, such as using multiple timeframes, analyzing volume, and leveraging trading software. Moreover, we've emphasized the importance of developing a trading strategy, practicing patience, and managing risk and emotions.
The Ultimate Chart Patterns Cheat Sheet is your trusty sidekick in the wild, unpredictable world of stock trading. Keep it close at hand as you navigate the markets, and watch as it helps you uncover hidden gems and potential pitfalls alike. With this invaluable tool by your side, you'll be well-equipped to spot opportunities and make well-informed trading decisions.
Now that you're armed with newfound knowledge and the Ultimate Chart Patterns Cheat Sheet, it's time to dive into the market and put your skills to the test. But remember, trading is a journey best traveled with like-minded companions. Share your experiences, learn from others, and consider joining a trading community to expand your network and knowledge. By connecting with fellow traders and exchanging insights, you'll continue to grow, adapt, and refine your trading prowess.
So, what are you waiting for? Grab your Ultimate Chart Patterns Cheat Sheet, and set sail on your journey to trading success. With the right tools, mindset, and determination, the stock market's treacherous waters will become your playground, ripe with opportunity and adventure. Happy trading!
Useful Links
Here are some well-known authors who have written about chart patterns trading:
- Thomas N. Bulkowski: Bulkowski is an experienced trader and the author of "Encyclopedia of Chart Patterns" and "Trading Classic Chart Patterns." He is considered one of the foremost authorities on chart patterns and has extensively researched their effectiveness.
- Al Brooks: Brooks is a trader and author of "Reading Price Charts Bar by Bar" and "Trading Price Action Reversals". He is known for his technical analysis approach to trading and his ability to interpret chart patterns.
- John J. Murphy: Murphy is a technical analyst and author of "Technical Analysis of the Financial Markets" and "Intermarket Technical Analysis". He is widely regarded as one of the pioneers of modern technical analysis and has written extensively about chart patterns and technical analysis techniques.
- Martin Pring: Pring is a technical analyst and author of "Technical Analysis Explained" and "The Complete Technical Analysis Course". He has more than 40 years of experience in the financial markets and is known for his expertise in technical analysis, including chart patterns.
- Steve Nison: Nison is a technical analyst and author of "Japanese Candlestick Charting Techniques" and "Beyond Candlesticks." He is credited with introducing candlestick charting to Western traders and has written extensively about chart patterns and technical analysis using candlesticks.
These authors have made significant contributions to the field of chart patterns trading and are highly respected in the trading community. Reading their books can help you develop better habits, understanding of chart patterns and how to use them in trading strategies.
FAQ Section: Chart Patterns Cheat Sheet
What are chart patterns?
Chart patterns are visual representations of price movements over a specific period of time. They are used by traders to identify potential trends and reversals in the market, helping them make informed decisions about when to enter or exit a trade.
What types of chart patterns are there?
Chart patterns can be categorized into three main types: reversal patterns, continuation patterns, and bilateral patterns. Reversal patterns signal a change in the prevailing trend, while continuation patterns indicate that the current trend is likely to persist. Bilateral patterns, on the other hand, can break out in either direction.
Why is it important to understand chart patterns?
Understanding chart patterns can help traders better anticipate market movements, enabling them to make more informed trading decisions. Identifying and interpreting these patterns can provide valuable insights into potential entry and exit points, as well as stop-loss placements.
What tools can I use to identify chart patterns?
Many trading platforms offer charting tools and technical indicators that can help you spot and analyze chart patterns. In addition, you can use the Ultimate Chart Patterns Cheat Sheet as a handy reference to quickly recognize and interpret common patterns.
Can I rely solely on chart patterns for trading decisions?
While chart patterns can be powerful tools, it's best to combine them with other technical indicators and analysis methods for a more comprehensive view of the market. This holistic approach can help you make better-informed trading decisions and manage risk more effectively.
How can I improve my skills in identifying and trading chart patterns?
Practice, patience, and continuous learning are key to mastering chart pattern identification and trading. Utilize a demo account or paper trading to hone your skills without risking real money, and consider joining a trading community to share experiences and learn from others.
How can I manage risk and emotions while trading chart patterns?
Developing a clear trading plan and setting appropriate stop-loss levels can help you manage risk effectively. Sticking to your plan, even in emotionally charged situations, is crucial for long-term success. Practicing patience and maintaining a disciplined approach to trading will also help keep your emotions in check.
Disclaimer:
The information contained in this article is provided for educational and informational purposes only. It is not intended to be investment or financial advice, and should not be taken as such. Cryptocurrency is a highly speculative and volatile market, and any investment made in it carries a significant risk. Before making any investment decisions, it is recommended that you seek the advice of a qualified financial professional to understand the potential risks and rewards associated with investing in cryptocurrencies.
